Q110. You have a data source that contains the following columns.
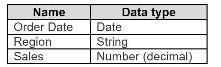
You want to filter regions based on the highest sales. Users must be able to specify the number of regions shown.
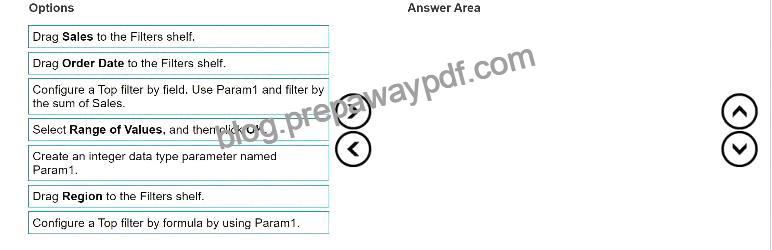
Which three actions should you perform in order? (Place the three correct options in order. Use the arrows to move Options to Answer Area.
Use Answer Area arrows to re-order the options.)
Explanation:
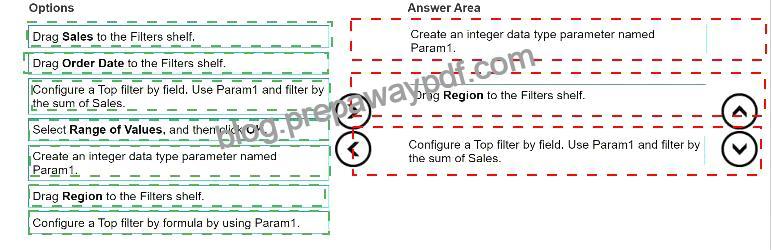
To filter regions based on the highest sales and allow users to specify the number of regions shown, you should perform these actions in order:
Answer area:
Create an integer data type parameter named Param1.
Drag Region to the Filters shelf.
Configure a Top filter by field. Use Param1 and filter by the sum of Sales.
To create a dynamic filter that lets users choose the number of regions to display, you need to use a parameter and a top filter. A parameter is a user-defined variable that can be used in calculations, filters, and reference lines. A top filter is a type of filter that shows only the top or bottom N values based on a specified field or expression.
In this question, you want to filter regions based on the highest sales. You also want users to be able to specify the number of regions shown. To achieve this, you need to follow these steps:
First, you need to create an integer data type parameter named Param1. This parameter will allow users to enter a number that will determine how many regions to show. You can create a parameter by right-clicking on the Data pane and selecting Create Parameter. Then, you need to specify the name, data type, current value, and allowable values for the parameter. In this case, you can choose Integer as the data type, 10 as the current value, and All as the allowable values. You also need to show the parameter control by right-clicking on the parameter and selecting Show Parameter Control. This will display a slider or a text box where users can enter or adjust the parameter value.
Next, you need to drag Region to the Filters shelf. This will open the Filter dialog box, where you can choose how to filter the Region field. You can filter by general, wildcard, condition, or top. In this case, you want to filter by top, so you need to select the Top tab.
Finally, you need to configure a top filter by field. Use Param1 and filter by the sum of Sales. This will filter the Region field by showing only the top N regions based on the sum of Sales, where N is the value of the parameter Param1. You can configure a top filter by field by selecting By field in the Top tab, then choosing the parameter Param1 from the drop-down list, and selecting the aggregation function Sum and the field Sales from the other drop-down lists. This will create a filter expression that looks like this: Top Param1 by SUM(Sales).
By following these steps, you will create a filter that shows only the regions with the highest sales, and allows users to change the number of regions shown by adjusting the parameter value.
References:
Tableau Certified Data Analyst Exam Prep Guide, page 10, section “Filtering Data” Tableau Help: Parameters Tableau Help: Top Filters

 by
by