Q119. Hotspot Question
Your company uses Microsoft Defender for Cloud and Microsoft Sentinel.
The company is designing an application that will have the architecture shown in the following exhibit.
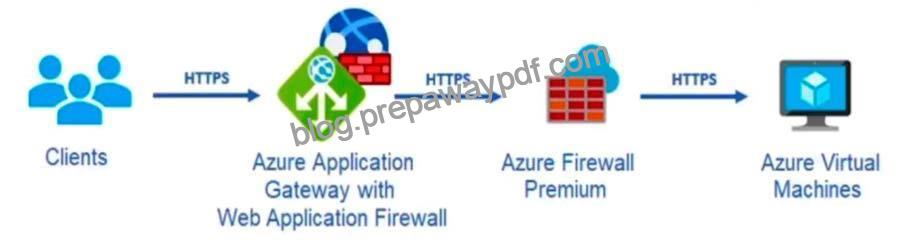
You are designing a logging and auditing solution for the proposed architecture. The solution must meet the following requirements:
– Integrate Azure Web Application Firewall (WAF) logs with Microsoft
Sentinel.
– Use Defender for Cloud to review alerts from the virtual machines.
What should you include in the solution? To answer, select the appropriate options in the answer area.
NOTE: Each correct selection is worth one point.
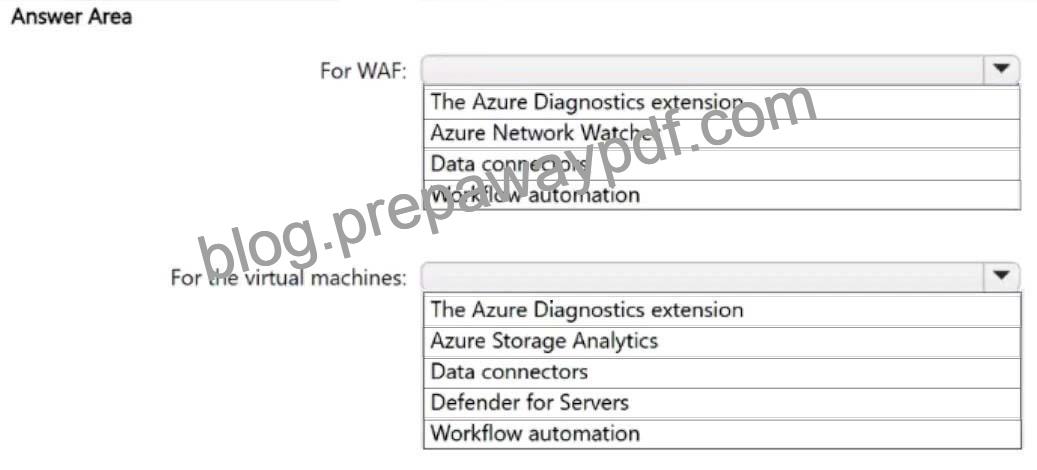
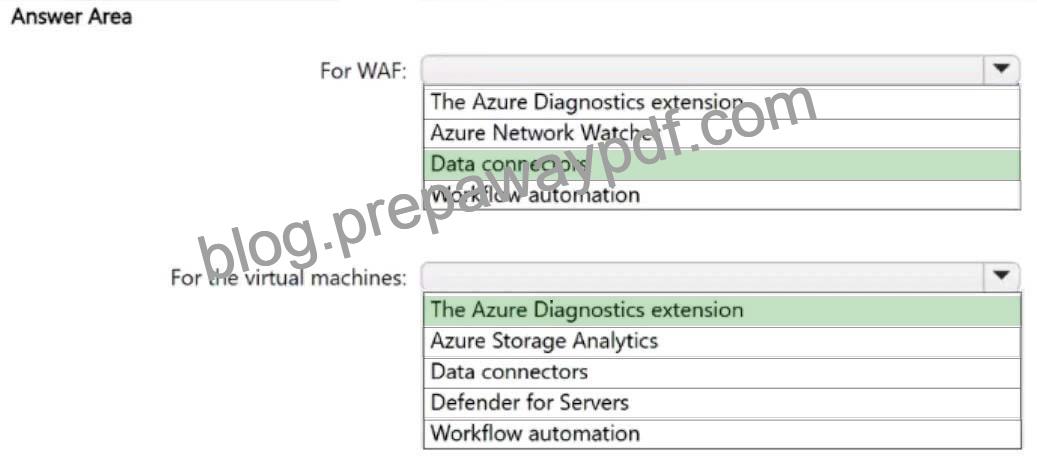
Explanation:
Box 1: Data connectors
Microsoft Sentinel connector streams security alerts from Microsoft Defender for Cloud into Microsoft Sentinel.
Launch a WAF workbook (see step 7 below)
The WAF workbook works for all Azure Front Door, Application Gateway, and CDN WAFs. Before connecting the data from these resources, log analytics must be enabled on your resource.
To enable log analytics for each resource, go to your individual Azure Front Door, Application Gateway, or CDN resource:
1. Select Diagnostic settings.
2. Select + Add diagnostic setting.
3. In the Diagnostic setting page (details skipped)
4. On the Azure home page, type Microsoft Sentinel in the search bar and select the Microsoft Sentinel resource.
5. Select an already active workspace or create a new workspace.
6. On the left side panel under Configuration select Data Connectors.
7. Search for Azure web application firewall and select Azure web application firewall (WAF).
Select Open connector page on the bottom right.
8. Follow the instructions under Configuration for each WAF resource that you want to have log analytic data for if you haven’t done so previously.
9. Once finished configuring individual WAF resources, select the Next steps tab. Select one of the recommended workbooks. This workbook will use all log analytic data that was enabled previously. A working WAF workbook should now exist for your WAF resources.
Box 2: The Azure Diagnostics extension
Azure Diagnostics extension is an agent in Azure Monitor that collects monitoring data from the guest operating system of Azure compute resources including virtual machines.
Comparison to Log Analytics agent
The Log Analytics agent in Azure Monitor can also be used to collect monitoring data from the guest operating system of virtual machines. You can choose to use either or both depending on your requirements.
The key differences to consider are:
* Azure Diagnostics Extension can be used only with Azure virtual machines. The Log Analytics agent can be used with virtual machines in Azure, other clouds, and on-premises.
* Azure Diagnostics extension sends data to Azure Storage, Azure Monitor Metrics (Windows only) and Azure Event Hubs. The Log Analytics agent collects data to Azure Monitor Logs.
*-> The Log Analytics agent is required for retired solutions, VM insights, and other services such as Microsoft Defender for Cloud.
Note: The Log Analytics agent is a better answer, but that option is not available in this version of the question.
Reference:
https://docs.microsoft.com/en-us/azure/web-application-firewall/waf-sentinel
https://docs.microsoft.com/en-us/azure/defender-for-cloud/enable-data-collection
https://docs.microsoft.com/en-us/azure/azure-monitor/agents/agents-overview
https://learn.microsoft.com/en-us/azure/azure-monitor/agents/diagnostics-extension-overview
 by
by